Trong quá trình luyện thi IELTS, bài writing task 1 là phần các bạn nên chú ý luyện tập để đạt điểm tối đa và gỡ điểm cho cả bài thi. Dưới đây là lời khuyên cực kỳ ngắn gọn, xúc tích mà chuyên gia tại British Council đã truyền đạt mà mình ghi chép lại được trong buổi đào tạo vào tháng 3/2020. Các bạn hãy tham khảo và làm theo nhé!
Bài viết được chia làm 5 phần
Phần 1: Tổng quan đề thi writing task 2
Phần 2: Dàn ý chuẩn cho bài viết writing task 1
Phần 3: 9 bước làm bài chuẩn đét cho mọi dạng biểu đồ
Phần 4: Từ vựng & ngữ pháp quan trọng
Phần 5: Luyện tập, luyện tập, và luyện tập
1. Tổng quan đề thi writing task 1
1.1. Thông tin chung
•Số từ: 150 words (minimum) tối thiểu 150 từ
•Thời gian làm bài: 20 minutes (phút)
•Dạng bài: Describes data (mô tả thông số, số liệu qua dạng bảng biểu)
•Tiêu chí chấm bài:
- Task achievement (did you cover the question?): đáp ứng đề bài (bạn đã trả lời đúng câu hỏi chưa?)
- Coherence& cohesion (link ideas, organize ideas): sự mạch lạc và liên kết (cách bạn tổ chức các ý và liên kết các ý ra sao)
- Lexical resource: từ vựng phong phú
- Grammatical range & accuracy: ngữ pháp đa dạng và chính xác
1.2. Các dạng biểu đồ
•Line graph: biểu đồ đường
•Bar graph: biểu đồ cột
•Pie chart: biểu đồ tròn
•Table: biểu đồ bảng
•Map/plan: bản đồ/ kế hoạch
•Process diagram: giản đồ dạng quy trình
1.3. Cách tính điểm
Mỗi tiêu chí trong 4 tiêu chí sẽ được đánh giá theo thang điểm 9, tổng điểm cho writing task 1 là trung bình cộng của điểm cho 4 tiêu chí. Điểm của bài writing sẽ là điểm task 1*1/3 + task 2*2/3
2. Dàn ý chuẩn cho bài viết writing task 1
Introduction: mở bài
- Say what the diagram is (biểu đồ mô tả cái gì?)
- Say what the main changes/ trend/ event/ etc. are (overview): nói tổng quan những thay đổi/ xu hướng/ sự kiện lớn diễn ra trong biểu đồ
Body: thân bài
- Choose the important parts of the graph/ chart/ map/ process to support your introduction: chọn các thông tin quan trọng trong biểu đồ và mô tả kỹ hơn để bổ sung giải thích phần mở bài
- Include the data (the %, the amount, the time/ year, etc.): viết ra các số liệu như là phần trăm, số lượng, ngày tháng năm diễn ra sự kiện nào đó.
Conclusion: kết bài (optional - if time is allowed) - nếu có thời gian
- Rephrase the introduction: nhắc lại phần mở bài theo cách khác
3. 9 bước làm bài chuẩn đét
Bước 1: Hiểu câu hỏi
Ở bước này, chúng ta cần tóm tắt thông tin và chọn rồi báo cáo những thông tin nổi bật và đưa câu so sánh ở đoạn liên quan. Hãy trả lời các câu hỏi sau:
- Số liệu gì được trình bày ở cột ngang, cột dọc?
- Có bao nhiêu năm trong biểu đồ?
- Có bao nhiêu sản phẩm/ nội dung khác nhau được trình bày? Đó là những gì?
Bước 2: Viết câu đầu tiên cho phần mở bài
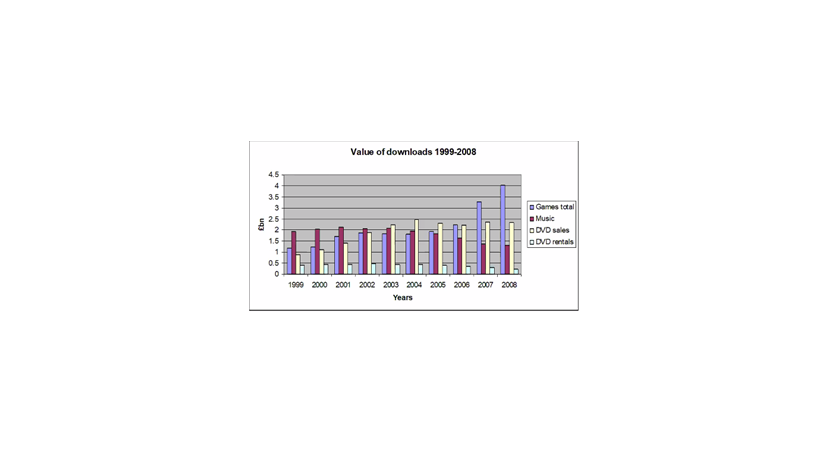
Câu đề: The chart below shows the value of Internet downloads in the UK from 1999-2008
Câu đầu của mở bài: The bar chart shows how much downloads of music, films and games are worth in the UK over a period of 10 years.
Các bạn đã thấy những câu hỏi bên bước 1 đều được trả lời trong câu này không nào? Và các bạn thấy những từ được sử dụng có giống câu đề hay đã được paraphrased?
Để biết cách paraphrase trong bài thi IELTS, hãy xem bài viết này:
https://langgo.edu.vn/cach-paraphrase-nhung-cum-tu-thuong-gap-trong-luyen-thi-ielts
Bước 3: Xác định các xu hướng chính
Hãy trả lời các câu hỏi sau:
- Cái gì nổi bật?
- Cái gì là dài nhất/ lớn nhất/ cao nhất/ thấp nhất/ nhỏ nhất?
- Cái gì thay đổi nhiều nhất?
- Cái gì không thay đổi?
Bước 4: Viết câu số hai cho phần mở bài (overview)
The bar chart shows how much downloads of music, films and games are worth in the UK over a period of 10 years. When compared to other downloads, it is clear that the main development over this period is the huge increase in the value of downloaded games.
Bước 5: Lựa chọn số liệu
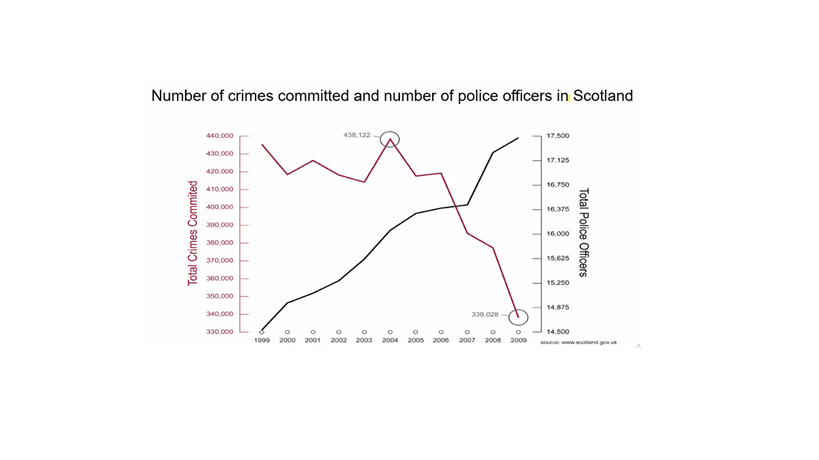
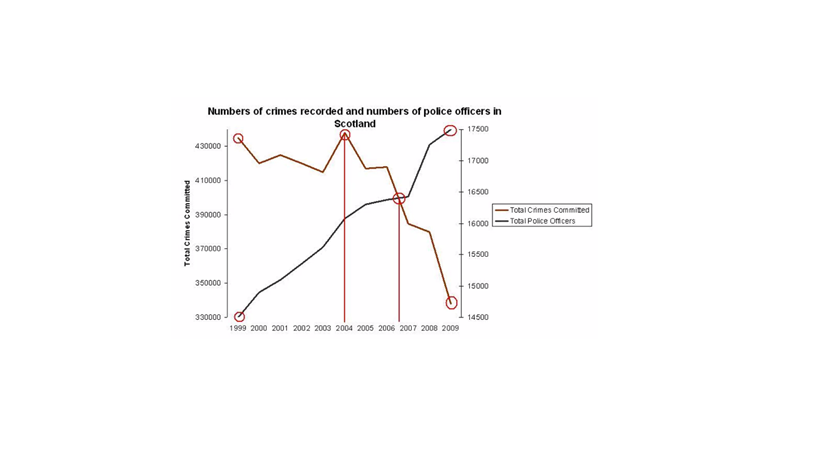
Với dạng biểu đồ đường thì việc chọn lựa số liệu sẽ có chút khó khăn vởi con số cách xa đường vẽ, để dễ xác định số liệu hơn, bí kíp là hãy vẽ đường thẳng thừ đoạn mình thấy có số liệu thay đổi lớn/ không hề thay đổi xuống phần con số về năm.
Bước 6: Quyết định thứ tự mô tả các số liệu đã chọn
Thông thường là hãy viết từ phần quan trọng/ nổi bất nhất tới ít quan trọng/ nổi bật
- Với biểu đồ đường: viết theo thứ tự thời gian
- Với biểu đồ tròn: viết theo số liệu lớn nhất tới nhỏ nhất
- Với biểu đồ cột, có thể chọn viết theo thông tin hoặc theo từng mảng
Bước 7: Viết phần thân bài
- Kiểm tra phần mở bài
- Nghĩ đến những ngôn ngữ phù hợp (so sánh, đối chiếu, tăng, giảm, v.v.)
- Nghĩ đến các từ nối (whereas, at the same time, v.v.)
- Nghĩ về độ dài (100-120 từ)
Lưu ý quan trọng về ngôn ngữ cho writing task 1:
- Hãy chính xác về các con số
- Không sử dụng ngôn từ chuyên môn, thành ngữ, cụm động từ. Chỉ cần mô tả chính xác
- Không cần sử dụng quá khứ hoàn thành, chỉ cần hiện tại hoàn thành hoặc quá khứ đơn là được
Bài mẫu:
In 1999 the value of downloaded games was just over one billion pounds almost half the value of music at just under 2 billion pounds. The value of the games increased steadily until 2002 when it reached just under 2 billion pounds. Over the same period the downloading of music had grown slightly and was then worth just over 2 billion. Between 2002 and 2005 the value of downloaded games reamained fairly stable whereas music decreased slightly. Then between 2006 and 2008 there was a huge rise in the worth of the games, reaching a peak in 2008 of about 4 million pounds. The reverse was true of the worth of music downloads. By 2008 they were valued at less than 1.5 billion.
Over the period 1999-2008 DVD sales rose from just under one billion to a peak of 2.5 billion in 2004 only to fall to about 2.25 billion in 2008. The value of DVD rentals remained under 0.5 billion pounds over the whole period.
Các bạn hãy chú ý nhìn vào màu khác nhau trên bài viết và xem màu gì tương ứng với từ vựng gì nhé!
Động từ: màu đỏ
Trạng từ: màu xanh biển
Từ chỉ số lượng: màu xanh lá
Bước 8: Viết phần kết bài
- Nhắc lại phần mở bài
- Nhắc lại xu hướng chủ đạo
- KHÔNG thêm thông tin
Bước 9: Kiểm tra lại
- Số liệu đã đúng chưa?
- Có lỗi ngữ pháp không?
- Có lỗi từ vựng không?
- Các đoạn văn rõ ràng chưa?
4. Từ vựng & ngữ pháp quan trọng
Để có thể viết được task 1 ngon lành, các bạn hãy chú ý từ vựng và ngữ pháp quan trọng sau nhé:

4.1. Từ vựng cho mở bài
Để viết câu mở đầu hấp dẫn và trọng tâm, bạn có thể chuẩn bị trước những từ vựng như dưới đây và linh hoạt nhằm viết lại câu đề bài thật hoàn chỉnh.
|
Dẫn dắt |
Loại biểu đồ | Động từ đi kèm | Tân ngữ mô tả |
|
The The given The supplied The presented The shown The provided |
diagram / table / figure / illustration / graph / chart / flow chart / picture/ presentation/ pie chart / bar graph/ column graph / line graph / table data/ data / information / pictorial/ process diagram/ map/ pie chart and table/ bar graph and pie chart | shows / represents / depicts / enumerates / illustrates / presents/ gives / provides / delineates/ outlines/ describes / delineates/ expresses/ denotes/ compares/ shows contrast / indicates / figures / gives data on / gives information on/ presents information about/ shows data about/ demonstrates/ sketch out/ summarises… |
the comparison of… the differences… the changes… the number of… information on… data on… the proportion of… the amount of… information on… data about… comparative data… the trend of… the percentages of… the ratio of… how the… |
Ví dụ:
- The given pie charts represent the proportion of male and female employees in 6 broad categories, dividing into manual and non-manual occupations in Australia, between 2010 and 2015.
- The line graph delineates the proportion of male and female employees in three different sectors in Australia between 2010 and 2015.
- The supplied bar graph compares the number of male and female graduates in three developing countries while the table data presents the overall literacy rate in these countries.
Đoạn Tổng quan nêu xu hướng trọng tâm bao trùm khi nhìn nhanh tổng thể vào bảng biểu, sơ đồ, bản đồ. Do vậy, các từ vựng IELTS Writing Task 1 hữu ích ở đây là:
- In general
- In common
- Generally speaking
- Overall
- It is obvious
- As is observed
- As a general trend
- As can be seen
- As an overall trend
- As is presented
- It can be clearly seen that
- At the first glance, it is clear
- At the onset, it is clear that
- A glance at the graphs reveals that…
Ví dụ:
- As is observed, the figures for imprisonment in the five mentioned countries show no overall pattern, rather shows the considerable fluctuations from country to country
- Generally speaking, citizens in the USA had a far better living standard than that of remaining countries.
- As can be seen, the highest number of passengers used the London Underground station at 8:00 in the morning and at 6:00 in the evening.
- At a first glance, it is clear that more percentages of native university pupils violated regulations and rules than the foreign students did during this period.
- Overall, the leisure hours enjoyed by males, regardless of their employment status, was much higher than that of women.
4.2. Từ vựng miêu tả xu hướng
| Xu hướng | Verb | Noun |
| Tăng | • Rise • Increase • Grow • Climb • Go up |
• A rise • An increase • A growth • A climb • An upward trend |
| Giảm | • Fall • Decrease • Reduce • Decline • Go down • Drop |
• A fall • A decrease • A reduction • A decline • A downward trend • A drop |
| Duy trì ở mức ổn định | • Remain stable/ steady • Stabilize • Stay stable/ unchanged |
• Stability |
| Dao động | • Fluctuate • Be volatile |
• A fluctuation • A volatility |
| Đạt mức cao nhất | • Hit the highest point • Reach a peak |
|
| Đạt mức thấp nhất | • Hit the lowest point |
4.3. Từ vựng mô tả tỷ lệ
- Phần trăm:
- 25 percent decrease
- dropped by 10 per cent
- reached to 75%
- 5 times higher
- stood exactly at 43%
- Tripled, doubled…
- Phân số
- 4% = A tiny fraction.
- 24% = Almost a quarter.
- 25% Exactly a quarter.
- 26% = Roughly one quarter.
- 32% Nearly one-third, nearly a third.
- 49% = Around a half, just under a half.
- 50% Exactly a half.
- 51% = Just over a half.
- 73% = Nearly three quarters.
- 77% = Approximately three quarters, more than three-quarters.
- 79% = Well over three quarters.
- Tỷ trọng
- 2% = A tiny portion, a very small proportion.
- 4% = An insignificant minority, an insignificant proportion.
- 16% = A small minority, a small portion.
- 70% = A large proportion.
- 72% = A significant majority, A significant proportion.89% = A very large proportion.
- 89% = A very large proportion.
4.4. Từ vựng miêu tả tốc độ mức độ thay đổi

4.5. Cấu trúc câu mô tả sự thay đổi
| Cấu trúc | Ví dụ |
| S + v + adv + number + time period | GM car sales increased significantly from $5,000 to $105,000 between 1960 and 2010 |
| There be + a/an + adj + noun + number + in + s + time period | There was a significant increase of $100,000 in GM car sales, from $5,000 to $105,000, between 1960 and 2010. |
| S + experienced/ saw + a/an +noun + number + time period | GM car sales saw a significant growth in GM car sales, from $5,000 to $105,000, between 1960 and 2010. |
4.6. Cấu trúc câu so sánh
|
Cấu trúc |
Ví dụ |
|
Compared to/with |
Prices in the UK are high compared to/with prices in Canada and Australia. |
|
In comparison to/with |
Prices in the UK are high in comparison to/ with prices in Canada and Australia
|
|
While/ Whereas/Although |
There are 5 million smokers in the UK, while / whereas only 2 million Canadians and 1 million Australians smoke. Between 1990 and 2000, the number of smokers in the UK decreased dramatically, while / whereas the figures for Canada and Australia remained the same.
Although the Middle East produced 100 tons oil, Japan produced none.
|
|
However/In contrast/ On the other hand |
The Middle East produces high levels of oil; however, Japan produces none. The USA produces large amounts of natural gas. In contrast, South Korea produces none. European countries make great use of solar power. On the other hand, most Asian countries us this method of power generation very little. |
4.7. Các cấu trúc so sánh khác
- Developing countries are more reliant on alternative energy production than developed countries.
- Solar power accounts for far less of the total energy production than gas or coal does.
- Hydropower is not as efficient as wind power.
- Like Japan, South Korea does not produce any natural gas.
- The Middle East produces twice as much oil as
- Western countries consume three times more oil than the Middle East.
- Russia consumes slightly more oil than Germany.
- The UAE produced the same amount of oil as Saudi Arabia.
4.8. Cách sử dụng giới từ
Khi mô tả số liệu và các đặc điểm, các giới từ như “to”, “by”, “with”, và “at” có vai trò rất quan trọng trong câu. Dưới đây là cách sử dụng các giới từ này trong bài viết, các bạn cùng tham khảo nhé:
- Dùng giới từ “to” khi mô tả sự thay đổi đến mức nào đó
Ví dụ: In 2018, the rate of unemployment rose to 10%
- Dùng giới từ “by” khi mô tả sự thay đổi một khoảng nào đó
Ví dụ: In 2009, the rate of unemployment fell by 2% (from 10% to 8%)
- Dùng giới từ “with” để mô tả phần trăm, số lượng chiếm được
Ví dụ: He won’t the election with 52% of the vote
- Dùng giới từ “at” để thêm con số vào cuối câu
Ví dụ: Unemployment reached its highest point in 2008, at 10%.
4.9. Từ vựng đồng nghĩa với xấp xỉ
- Approximately
- Nearly
- Roughly
- Almost
- About
- Around
- More or less
- Just over
- Just under
- Just around
- Just about
- Just below
- A little more than
- A little less than.
5. Luyện tập, luyện tập, và luyện tập
Kiến thức đã có đủ rồi, bây giờ là cùng viết bài. Một cách hay để luyện những kiến thức trên là cùng phân tích bài mẫu của thầy Simon và xem cách thầy mô tả cũng như là tổ chức ý ra sao nhé! Mình đưa ra 2 bài mẫu cho 2 dạng khó nhằn nhất là process và map
5.1. Bài mẫu dạng process
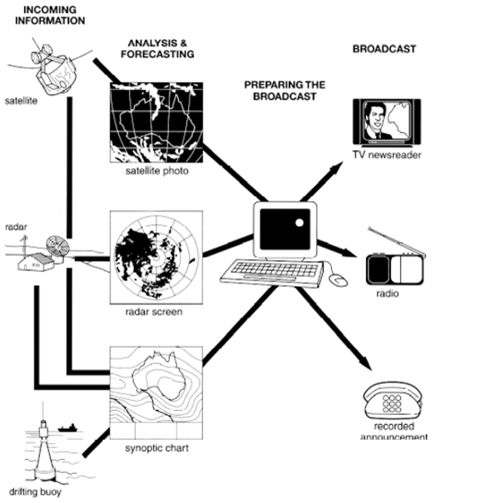
The figure illustrates the process used by the Australian Bureau of Meteorology to forecast the weather.
There are four stages in the process, beginning with the collection of information about the weather. This information is then analysed, prepared for presentation, and finally broadcast to the public.
Looking at the first and second stages of the process, there are three ways of collecting weather data and three ways of analysing it. Firstly, incoming information can be received by satellite and presented for analysis as a satellite photo. The same data can also be passed to a radar station and presented on a radar screen or synoptic chart. Secondly, incoming information may be collected directly by radar and analysed on a radar screen or synoptic chart. Finally, drifting buoys also receive data which can be shown on a synoptic chart.
At the third stage of the process, the weather broadcast is prepared on computers. Finally, it is delivered to the public on television, on the radio, or as a recorded telephone announcement.
(170 words)
5.2. Bài mẫu dạng map
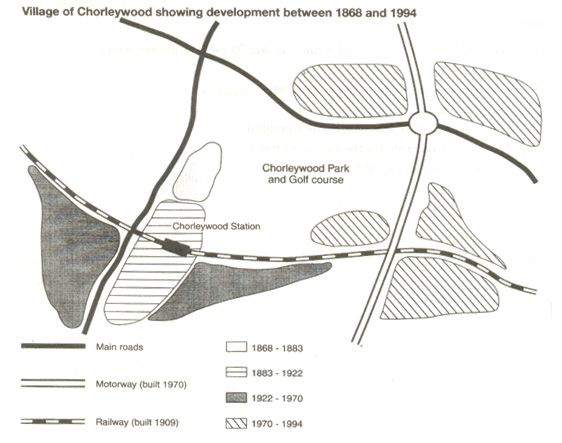
The map shows the growth of a village called Chorleywood between 1868 and 1994.
It is clear that the village grew as the transport infrastructure was improved. Four periods of development are shown on the map, and each of the populated areas is near to the main roads, the railway or the motorway.
From 1868 to 1883, Chorleywood covered a small area next to one of the main roads. Chorleywood Park and Golf Course is now located next to this original village area. The village grew along the main road to the south between 1883 and 1922, and in 1909 a railway line was built crossing this area from west to east. Chorleywood station is in this part of the village.
The expansion of Chorleywood continued to the east and west alongside the railway line until 1970. At that time, a motorway was built to the east of the village, and from 1970 to 1994, further development of the village took place around motorway intersections with the railway and one of the main roads.
(174 words)
Các bạn có thể lên trang của thầy Simon tại đây: https://ielts-simon.com/
Chúc các bạn ôn thi thật tốt và đạt điểm cao!